
Why Horse Racing Statistics Can Be Both Powerful—and Misleading
Horse racing statistics are a vital tool when used with context and depth. For many punters, stats are the foundation of their entire approach to form study. But there’s a growing issue—too often, statistics are used in isolation, without the deeper analysis needed to interpret them correctly.
Every day on social media and forums, I see punters relying on raw stats—things like “trainer 20% strike rate at this course” or “jockey has 3 wins from 6 rides here”—as if those numbers alone can predict the outcome of a race. While these stats can provide insight, they often lack context, which is where many go wrong.
Used correctly, horse racing data can highlight patterns, reveal trainer intent, and uncover hidden angles. But it’s rarely as simple as picking the stat and backing the horse. The truth is: numbers without understanding can mislead, not guide.
In this section, I’ll give you examples of:
What I consider strong racing statistics and why they carry value
Examples of weak or misused stats that are commonly posted but often add little to real betting insight
There is a place for a stats-based approach in horse racing betting—but it requires depth, context, and an understanding of when a stat is genuinely predictive… and when it’s just noise.
Misleading Racing Stats: The Problem with Surface-Level Numbers
It’s a fact that horse racing statistics don’t lie—but when they’re used without context or depth, they can be highly misleading. On paper, some stats might appear strong and are technically accurate, but if they lack logical relevance to today’s race conditions or fail to reflect deeper form patterns, they offer little real value. In this section, I’ll show a couple of examples of stats that are commonly shared across social media and why, despite sounding valid, they can lead to poor betting decisions when misused.
A Popular Post That Lacked Substance
I recently saw this post on a social media platform that actually received a lot of interaction. Clearly, people were drawn into it at face value, likely because the stat looked impressive and felt trustworthy.

So the post—Michael Herrington did have a 25% strike rate at Southwell. As I said, it’s not the number that’s the issue here.
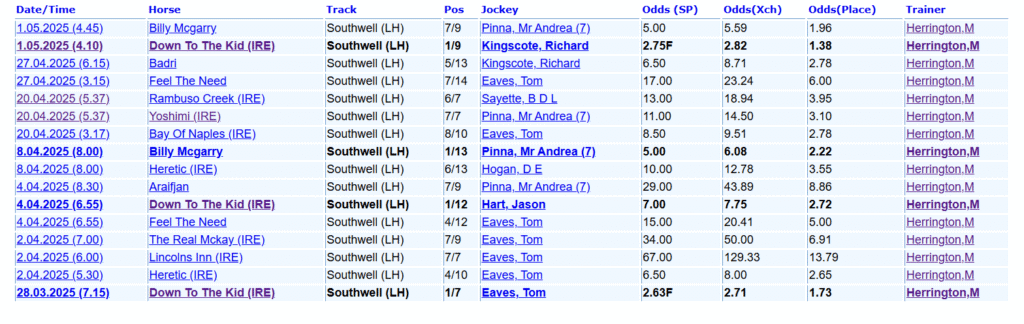
The image above shows all of this trainer’s runners at Southwell during the stated time frame. While the 25% strike rate is technically accurate, a closer look reveals that 3 of the 4 winners came from the same horse. This highlights the problem—on the surface, the statistic looks strong.
On the day the post was made, it was actually Billy McGarry who was running—a completely different horse. While this horse may have had a previous win at Southwell, its form had come over a mile or further, and this particular race was over 7 furlongs. There were also several other factors against it on the day, meaning it never really had a realistic chance—despite the trainer’s so-called 25% strike rate. In this context, the stat was entirely irrelevant.
I do appreciate that there may be a valid horse profile angle worth exploring here. The horse responsible for those Southwell wins—Down To Earth—looks something of a course specialist. That insight could potentially prove useful in the future. But it’s important to separate the horse’s achievements from the trainer’s wider intent. The 25% stat gave the impression that the trainer was targeting Southwell consistently, when in reality, the figure was inflated by repeated wins from a single runner. There’s a big difference—and it shows how misleading stats can be without proper context.
To further back this up the actual trainer in question over the longer term has rarely reached a 10% strike rate for a single year at Southwell .
The next example is one I’m sure most of you have come across at some point—trainer Willie Mullins at the racecourse Naas. It’s the kind of stat that’s often highlighted across previews and social media: high win percentages, strong profit figures, and a reputation that naturally draws attention.

On the surface, the numbers are impressive. But as we’ll explore below, even stats like this—while accurate—can be easily misinterpreted when used without understanding the race type, opposition, or odds profile. Just like the previous example, it’s not the numbers that are the problem—it’s the lack of depth behind them
What we need to understand here is that this trainer often runs more than one horse in a single race—as shown in the image below.
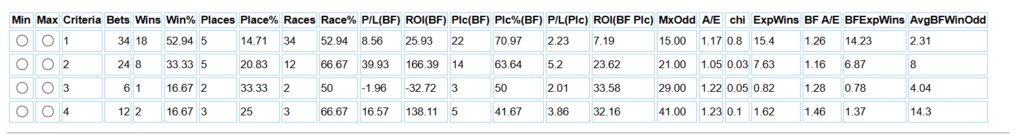
Most people at this point would naturally gravitate toward the favourite when Willie Mullins has more than one runner in a race. It’s a common assumption: pick the shortest-priced horse and trust the trainer’s strike rate to do the rest. If you filtered the data to only include races where he runs a single horse, yes—the strike rate would look higher. But even then, your returns would be modest at best, and in many cases, you’d be lucky to break even.
Now, let’s just focus on races where Mullins has more than one runner and you opt for the favourite—as most of his horses tend to dominate the top of the market. Look at the image below : the favourite angle performs significantly worse than the non-favourite runners in terms of ROI, strike rate, and overall value. The data shows a negative ROI of -58.66% on favourites compared to +196.76% on non-favourites, despite fewer wins from the latter. It’s a clear example of how betting based on surface-level logic and trainer reputation alone can lead to poor decisions.

So from all the above, if you had simply gone with the initial headline stat, you’d have been in for a shock once the actual betting started. In many of these races, you’d have needed to back multiple runners just to stay involved. But if the stat had been drilled down a little further, it would have revealed that the real angle was backing non-favourite Mullins runners in races where he had more than one entry.
Why? Because most punters automatically gravitate to the shortest-priced horse. These favourites are often overbet—yes, they perform slightly better in terms of strike rate, but the profit comes from the bigger-priced, overlooked runners. Hopefully this shows that if you do follow statistics, it’s worth digging deeper. Sometimes the same stat—when properly broken down—can reveal a completely different and far more valuable insight.
So, by following the revised stat—targeting only the non-favourite runners in races where Mullins had more than one entry—you would have placed just 31 bets and made a profit of 61 points to £1 stakes. Compare that to the original approach based on the headline stat, which required 76 bets for a profit of 68 points. That’s only a 7-point difference in return, but with less than half the number of bets. The reduced volume with near-identical profit clearly shows that refining your stat usage is well worth the sacrifice.
Using Stats the Right Way — It’s a Long Game
It’s important to point out here that stats come in many forms, and they’re only ‘stats’ until they’re not — if that makes sense. What I mean by that is: numbers only matter if the logic behind them holds. A stat without reasoning is just a pattern waiting to break. So if you’re going to use stats in racing, they need to stand up to long-term scrutiny. They need to make sense before they make profit.
In my opinion, this is where the world of racing stats starts to blend into Horse Racing system-based thinking — especially around micro-systems. And that’s not necessarily a bad thing, as long as it’s done right.
The best way to use stats in a positive way is to build up a portfolio of logical angles, rather than chasing one killer edge. Most good stats will only produce small but steady profits — because chances are, you’re not the only one using them. But when you compound those small, logic-driven edges across a portfolio, that’s where the real power lies.
And here’s the key bit: you’ve got to trust the stat. If it’s well built and grounded in logic, then you need to let variance play out. Don’t jump off after a poor week or two. These are long-term tools. They aren’t for punting from the hip — they’re for building discipline, confidence, and sustainable performance over time
A Stat That Makes Sense – Built on Logic, Not Luck
So far we’ve covered how not to use stats — lazy filters, misleading strike rates, and patterns that collapse the moment you apply racing sense. But here’s an example of a stat that actually holds up. And more importantly, it makes sense once you understand the mechanics behind it.
The stat:
985 bets
404 winners (41.02%)
+60.27pts profit to BFSP
ROI: +6.12%
Place Strike Rate: 71.17%
Betfair A/E: 1.08
Average BF Win Odds: 2.59
Filters used:
Race Code: National Hunt & All Weather
Jockey: Female
Jockey Race Type: Amateurs
Favouritism: Favourite or Joint-Favourite
Odds (SP): 1.06 to 4.00
On the surface it looks simple: backing female amateurs on favourites in lower-grade NH and AW races. But the logic underneath is what gives this stat real value.
In these amateur races, female jockeys are consistently underbet — despite often being on the best horse and, in many cases, being more race-hardened than their male counterparts. Why? Because in amateur ranks, there are still far more male riders than female, and punters tend to recognise the same few male names over and over. That familiarity shapes perception — and perception drives market confidence.
But what people don’t see is that female amateurs ride less frequently, so it takes them longer to ride out their claim. That means when they are booked, they’re often sitting on the best horse (i.e., the favourite), and crucially, they’re bringing more race-riding experience plus the advantage of a bigger claim. It’s a double edge.
So we’ve got:
A horse the market already rates top (favourite)
A jockey who likely has more actual riding experience
A race type where strength is less important than rhythm, positioning and decision-making
And a price range that’s short enough to be reliable, but still value-laden due to misperception
The result? Not only a high strike rate, but long-term profit at BFSP — something you very rarely see with favourites unless the logic behind the selection is properly sound.
This isn’t guesswork, it’s not a ‘trend’ — it’s a structural edge based on how these races work and how these jockeys are used. That’s how you use stats properly: build them from the ground up, using logic first — the numbers will follow.
Of course not all stats will continue to work for various reasons depending on how they were measured ,Those people that do use horse racing stats successfully can do ok,Its not my personal favourite betting medium but I do see a strong case to be made for using them in the right context.
Final Thoughts – Make Stats Work for You, Not to You
The biggest mistake people make with horse racing stats is expecting them to do all the work. Stats don’t predict outcomes — they highlight patterns. It’s your job to ask whether those patterns make sense within the structure of how races are run, how horses are placed, and how riders are used. If you skip that step, you’re just data chasing.
But when you combine logic-first thinking with clean, disciplined stat building — that’s when the edge becomes real. Especially when you accept that this game isn’t about instant gratification. It’s about compounding small advantages and trusting your angles through ups and downs.
No stat wins forever. But good ones — the ones built with thought and backed by context — will hold their shape over time. That’s what we’re after.
Build your portfolio, question everything, and most of all — let logic lead.


NEXT UP
How To Read A Race Card
Learn how to compare a horse’s projected ceiling with their Official Rating to assess suitability.